Brief • 1 min Read
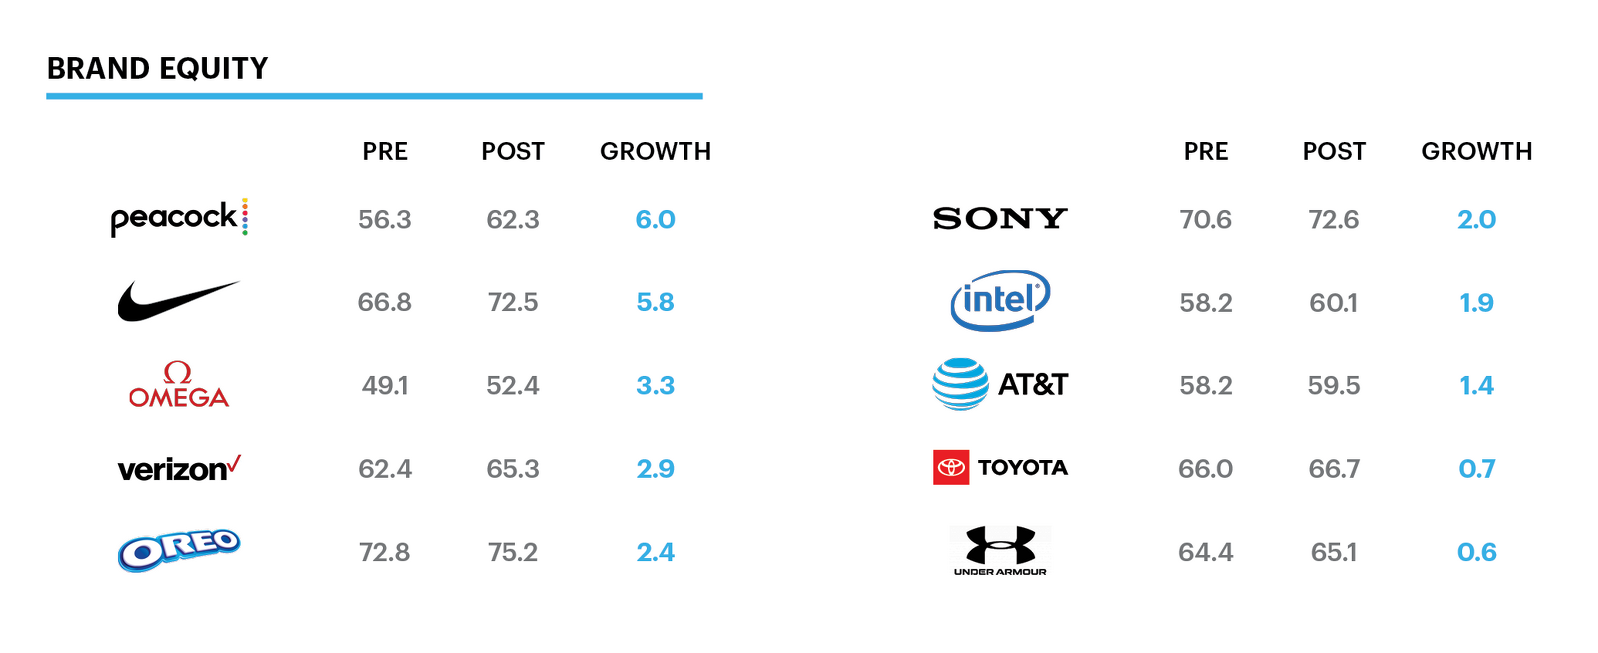
This index was determined by measuring the growth in brand equity for Olympics advertisers and sponsors from July 2–22, 2021 to July 23–August 10, 2021.
QuestBrand’s research report on the 2020 Tokyo Olympics, “Brands Going for Gold” reveals the relative impact of major brands’ sponsorships, partnerships and advertisements on consumer perception and behavior following the games.
To capture a comprehensive picture of the event’s impact, we polled on consumers’ watch plans ahead of the event vs. their actual watch behavior; measured the brand lift of major brand sponsors and partners; and assessed the impact of these brands’ creative campaigns on U.S. consumers.
The goal of this research is to better understand the relative value of Olympics-adjacent sponsorships and ad campaigns — and to deliver a resource for brands, marketers and advertisers considering participation in the future Olympic Games.
QuestBrand measures key metrics that help understand overall brand impact, including overall equity, brand momentum, purchase consideration, perceived quality and familiarity with the brand. With our always-on, real-time platform, marketers are able to plan campaign strategy, and even measure the results among their key audiences.
This index was determined by measuring the growth in brand equity for Olympics advertisers and sponsors from July 2–22, 2021 to July 23–August 10, 2021.


Fill in this form to learn more about the brand performance of the major sponsors and advertisers at the 2020 Tokyo Olympic Games.
The brand index was determined by measuring the change in brand equity between users of TikTok over the last 30 days and the U.S. general population during the beginning and end of the data collection period. Brand equity data for this report, including the metrics for brand equity’s underlying components and emotional perceptions metrics, were collected from March 27, 2021, to April 20, 2021, using QuestBrand.
Additional consumer insights were derived from a survey conducted online within the United States from March 26, 2021, to March 29, 2021, among 1,708 adults (aged 18 and over) by The Harris Poll. Figures for age, sex, race/ethnicity, education, region and household income were weighted where necessary to bring them into line with their actual proportions in the population. Propensity score weighting was used to adjust for respondents’ propensity to be online.
All sample surveys and polls, whether they use probability sampling, are subject to multiple sources of error which are most often not possible to quantify or estimate, including sampling error, coverage error, error associated with nonresponse, error associated with question wording and response options, and post-survey weighting and adjustments. Therefore, the words “margin of error” are avoided as they are misleading. All that can be calculated are different possible sampling errors with different probabilities for pure, unweighted, random samples with 100% response rates. These are only theoretical because no published polls come close to this ideal.
Respondents for this survey were selected from among those who have agreed to participate in our surveys. The data have been weighted to reflect the composition of the adult population of each metropolitan area. Because the sample is based on those who agreed to participate in the online panel, no estimates of theoretical sampling error can be calculated.
Responses for both brand index and consumer insights studies were tested for statistical significance using a Z-test with a confidence level of 95% and a Z-test with a confidence level of 90%.
Subscribe to our newsletter for the latest trends in business, culture, and more.