


Brief • 3 min Read
Much like summer and spring breaks in the academic calendar, the winter holiday season provides ample quality time for Chicago’s families to explore local tourist attractions. The Harris Poll recently surveyed 1,000 Cook County residents to investigate the city’s hotspots for city and suburban residents to spend free time. According to our survey results, parks are the most visited attraction in the city, followed by Lake Michigan and Museum Campus. Below are some of the key findings.
Most residents enjoy spending time in downtown Chicago, but safety remains a concern.
Seven in 10 Cook County residents (71%) at least somewhat agree that they enjoy spending time in downtown Chicago (City residents: 75% | Suburb residents: 66%). Still, only half (53%) at least somewhat agree that they feel safe doing so (City residents: 60% | Suburb residents: 46%).
Local tourism may be an overlooked opportunity for the city.
Seven in 10 Cook County residents (69%) at least somewhat agree that Chicago’s tourism industry is still recovering from the COVID-19 pandemic (City residents: 68% | Suburb residents: 70%). Similarly, less than half (44%) at least somewhat agree that area entertainment options are more for visitors than for residents (City residents: 47% | Suburb residents: 40%).
Chicago’s most notable landmarks attract residents from both the city and suburbs.
Three-quarters (73%) of Cook County residents at least somewhat agree that they take advantage of the entertainment options (e.g., events, attractions) Chicago has to offer (City residents: 79% | Suburb residents: 66%). Nearly all city residents (95%), and 82% of residents of the Cook County suburbs at least somewhat regularly utilize (i.e., at least a few times a year) recreational resources in the City of Chicago.
Attractions are categorized among public outdoor spaces, major tourist attractions, and popular paid events. The top attractions are:
- Public outdoor spaces (net: any of the below): 80% of city residents (vs 59% of suburb residents)
- Parks: 58% (vs 31%)
- Lake Michigan: 56% (vs 44%)
- Riverwalk: 38% (vs 28%)
- Walking trails: 36% (vs 15%)
- Major tourist attractions (net: any of the below)): 71% of city residents (vs 66% of suburban residents)
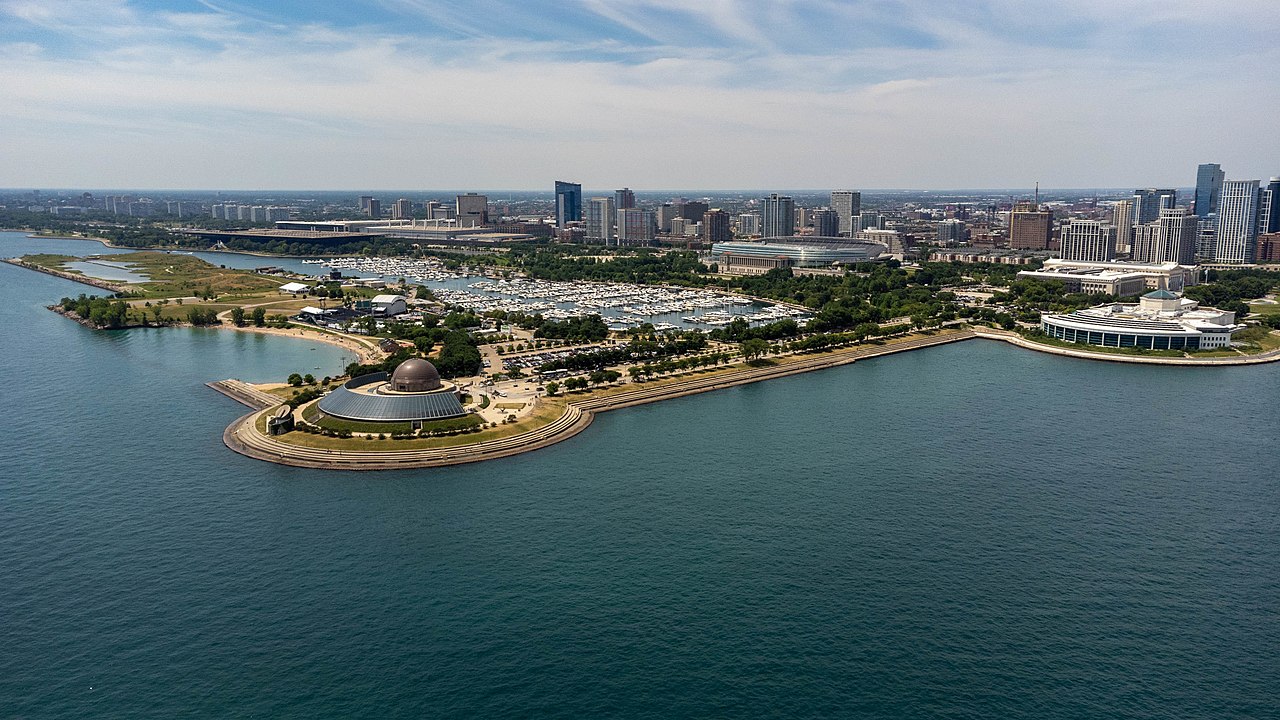
- Museum Campus and related institutions: 46% (vs 43%)
- Navy Pier: 42% (vs 44%)
- Magnificent Mile: 40% (vs 32%)
- Area tours (e.g., architectural boat tour, walking tour): 20% (vs 16%)
- Popular paid events (net: any of the below): 58% of city residents (vs 54% of suburban residents)
- Major festivals: 32% (vs 29%)
- Professional sporting events: 31% (vs 30%)
- Theater district(s): 25% (vs 25%)
This survey was conducted online in the United States by The Harris Poll from September 13, 2023 to September 20, 2023 among 1,000 residents of Cook County, IL, aged 18+. Figures were weighted where necessary to align with actual proportions within the population. For additional information, please contact The Harris Poll.
Subscribe for more Insights
Subscribe to our newsletter for the latest trends in business, politics, culture, and more.
Related Content