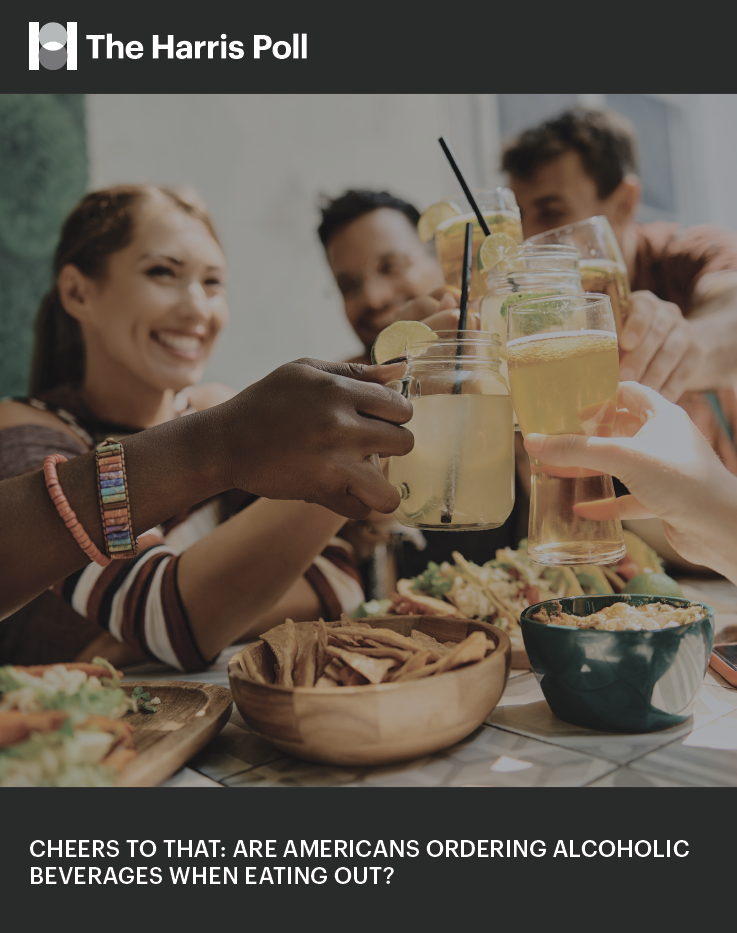

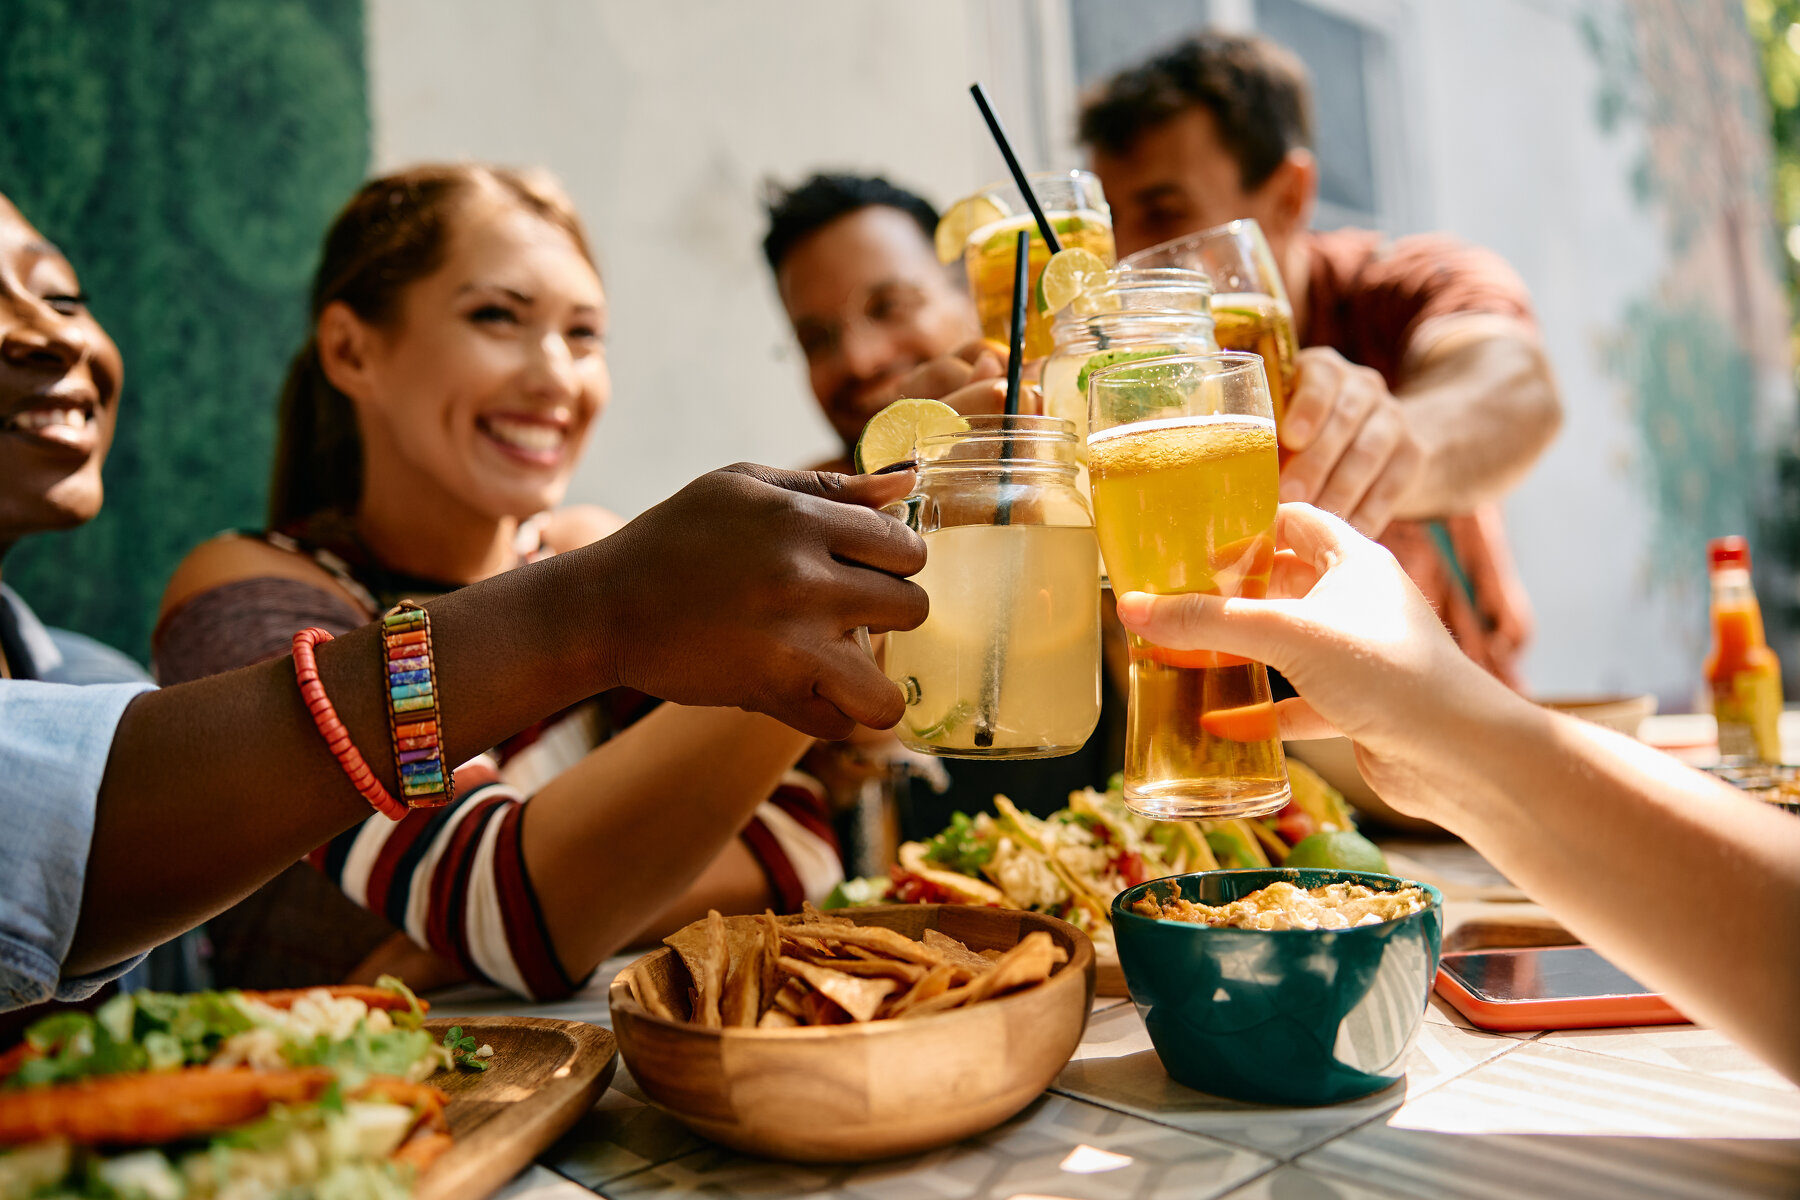
Whether with family, friends, or your significant other, eating out is a festive experience, and begs for a beverage to match!
Over a third (36%) of Americans say alcohol is their go-to drink when ordering at a restaurant, edging out soda (29%) and water (21%).
However, a recent Harris Poll run in partnership with eMarketer found that Americans’ restaurant beverage orders are more nuanced than they first appear – with plenty of generational differences.
Maybe not as festive, but non-alcoholic beverages retain a firm foothold
Seven-in-10 (69%) Americans who dined out in the last 30 days ordered at least one alcoholic drink. While this makes up the majority of restaurant-goers, alcoholic beverage orders fall short of those ubiquitous non-alcoholic standbys – water (89%) and soda (78%).
The most popular alcohol order? Cocktails (50%), followed by beer (49%) and spirits (46%). Not as sought-after as their alcohol-containing counterparts, U.S. adults also show an interest in non-alcoholic beverages, with approximately one-third ordering mocktails (33%) or NA alternatives (32%) (See graph below).
Consumers’ interest in non-alcoholic beverages does not suggest that the alcoholic beverage industry is at risk. According to a 2023 Harris Poll, only 4% of young adults (ages 18-34) who drink mock-alcoholic beverages do not drink any alcohol (e.g., sober, religious beliefs). A fifth (19%) of young adults try mock-alcoholic beverages out of curiosity, and 17% think they are an interesting menu option.
Additionally, alcohol has become an ingrained part of the social experience. According to the same survey, seven-in-10 (67%) young adults say that alcoholic beverages are more festive than mock-alcoholic beverages. And nearly half (43%) of young adults feel uncomfortable abstaining from alcohol if they are in a setting where most people are drinking alcohol.
Beverage preferences often fall across generational lines
Beyond personal preference, the data clearly shows that some generations indulge in alcoholic beverages more than others. Millennials (50%) and Gen X (40%) are much more likely than Baby Boomers (26%) or Gen Z (25%) to name an alcoholic drink as their go-to restaurant beverage. Instead, Gen Z gravitates to soda (32%), while Baby Boomers prefer water (31%).
“We’re watching two different philosophies play out at the same table: Millennials treat alcohol as their ticket to transform ordinary meals into curated experiences, while Gen Z approaches drinking like a strategic choice—they’ll sip a craft cocktail or a soda with equal enthusiasm, depending on what fits their mood and wallet.” – Libby Rodney, Chief Strategy Officer at The Harris Poll
Download the full report to learn more about the variations between Gen Z and Millennial alcoholic beverage preferences.
METHODOLOGY
This survey was conducted online within the U.S. by The Harris Poll from July 24th to 26th, 2025, among a nationally representative sample of 2,106 U.S. adults.