
In an industry where data drives decisions from brand strategy to C-suite confidence, the priority questions in market research that brands need to ask are: “How much does this sample cost?” And: “How much is bad data costing us?”
At The Harris Poll, we believe that data quality is not a luxury. It is the foundation of everything we do. We’re doubling down with the infrastructure, the research, and the voices to prove it.
The problem: When quality signals are unclear, vibes win
Here’s an uncomfortable truth about the market research industry: in the absence of good quality signals, procurement decisions are often driven by gut feeling rather than evidence.
Without clear, measurable indicators of data quality, buyers default to the lowest cost-per-interview (CPI) — assuming price is the most reliable signal of value. But that assumption is costly, in more ways than one.
And the problem runs even deeper than procurement. Even once a study is in the field, researchers face a growing and sophisticated threat: bad actors who adapt faster than the tools designed to catch them.
The hidden cost of “cheap” data
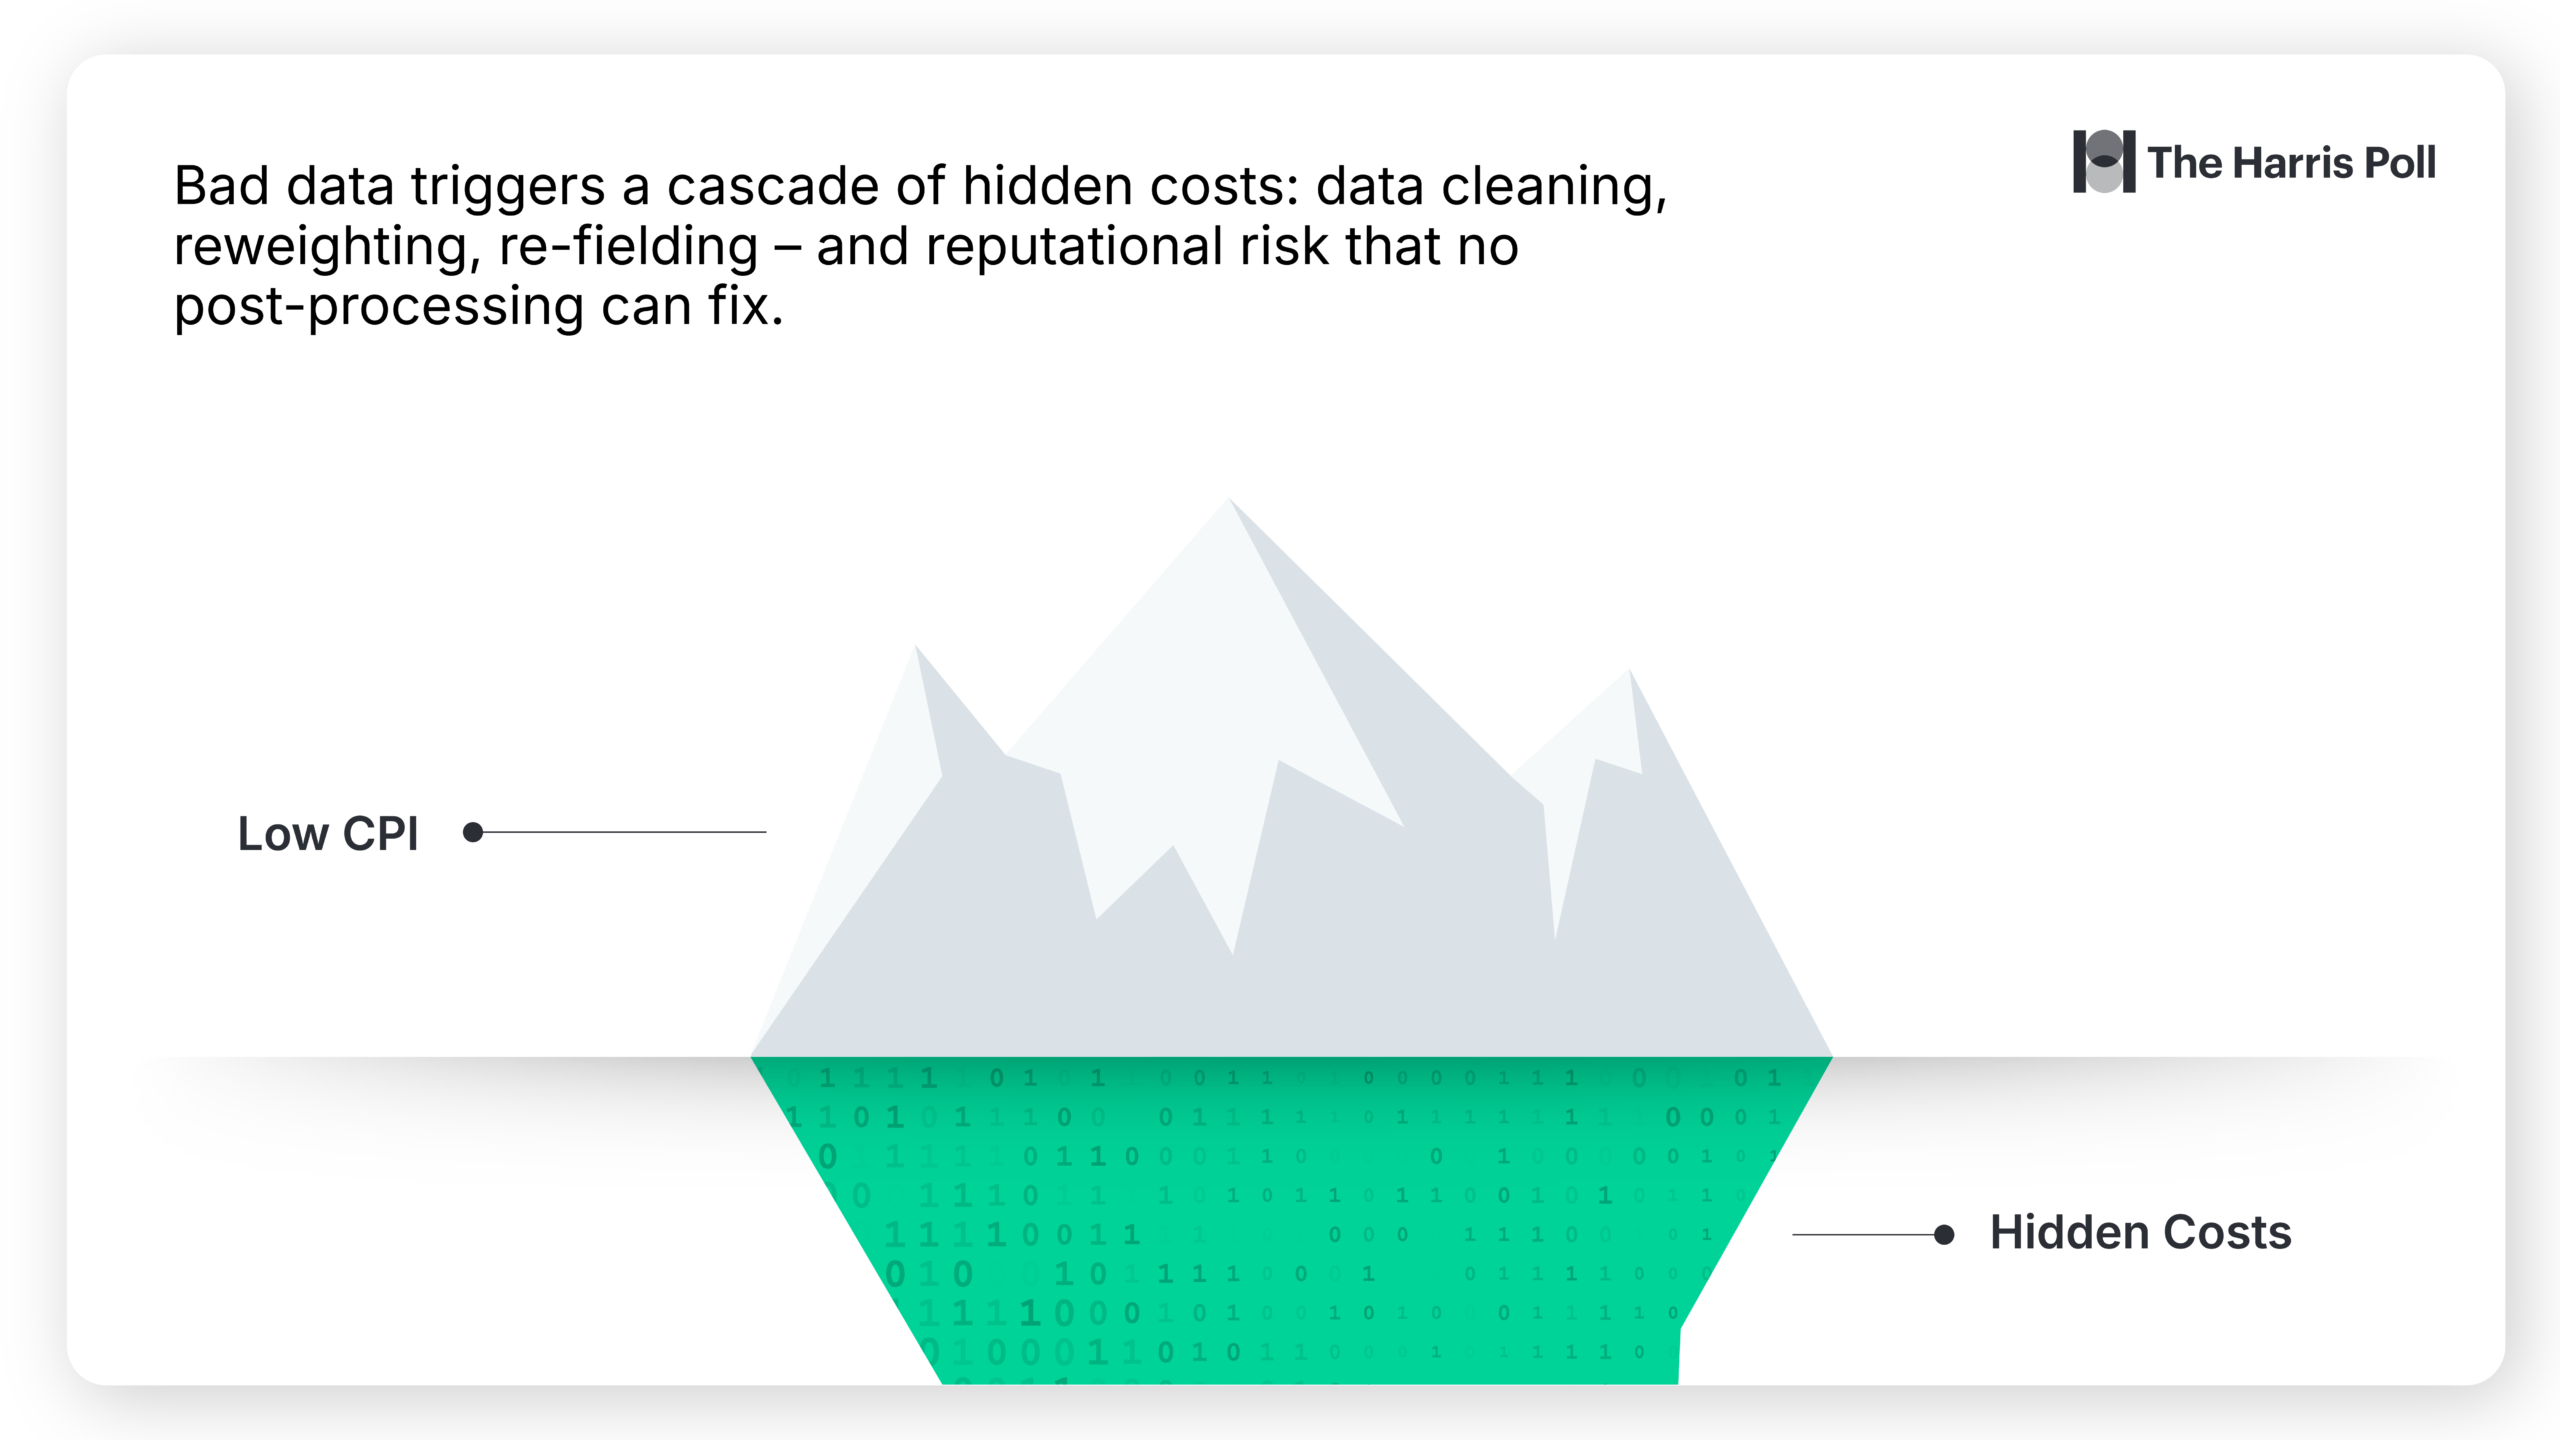
Low CPI may look attractive on a procurement spreadsheet, but it rarely tells the full story. When you factor in the hidden costs of poor-quality data, the economics shift dramatically:
- Data cleaning: time-consuming, resource-intensive, and never fully restorative
- Reweighting: a band-aid that signals something went wrong upstream
- Re-fielding: the most expensive outcome of all
- Reputational risk: clients trust data less when it requires significant post-processing to be usable
The bottom line: low CPI data isn’t really inexpensive once the true cost of remediation is counted. Buyers need quality to be visible, measurable, and priced into the decision from the start.
The evolving threat
Procurement governance is only part of the equation. At the respondent level, ensuring data quality in online survey research has become a hydra: every time one problem is solved, bad actors find two new ways to attack the survey.
Consider one of the most widely used data quality checks in quantitative research: the Root Likelihood Score (RLH), a powerful behavioral metric that measures how consistently a respondent’s choices align with a rational decision-making model. It’s a strong signal — but not a complete one.
Here’s the challenge with relying on any single metric:
- Bad actors can “solve” a check. Fraudulent respondents and bots can learn to game RLH by, for example, always selecting the shortest or longest item in a list, or ranking options alphabetically. These responses can produce high RLH scores while contributing zero real insight.
- Good actors can be unfairly penalized. Respondents with genuinely shallow preferences — say, a real consumer who simply doesn’t have strong opinions in a category — may score low on RLH and be incorrectly removed. Removing these respondents doesn’t clean the data; it distorts it, artificially inflating preference strength and willingness-to-pay metrics.
The result: adjusting a single quality threshold cannot simultaneously protect against both false positives and false negatives.
To truly manage data quality, you need a multi-signal approach.
Our answer: A quantitative governance infrastructure built for the modern era
At The Harris Poll, we measure, track and act on quality in real time. Our Data Quality Co-op (DQC) Quality Intelligence Infrastructure is the backbone of our quantitative governance process, combining both traditional and cutting-edge tools:
Traditional tools
- Annual Research on Research (RoR): longitudinal benchmarking that allows us to pre-screen suppliers and identify quality trends over time
- Quality Study: a structured review of data integrity across our vendor ecosystem
New and automated tools
- Quality Quadrant: a visual framework for assessing vendor positioning across performance dimensions
- Vendor Scorecard Rankings: standardized, comparable performance data across suppliers
- Failure Ratio Score: a quantitative measure of data integrity at the respondent and vendor level
- Vendor Performance Score (VPS): a qualitative partner assessment across five key dimensions:
- Communication
- Performance reliability
- Data quality
- Solution orientation
- Sampling execution
- DQC Auto-Generated Post-Fielding Satisfaction Survey: closing the loop with systematic, automated feedback after every project
Quality is not about achieving perfect data. No methodology can promise that.
What we can promise is something more valuable and more durable: “Quality is about systemic, measurable, quantitative governance.”
It means having the tools to know when something is wrong. It means having the processes to act on that knowledge. And it means having the transparency to share that story with our teams, our clients, and our partners.
Whether it’s at the procurement level: eliminating hidden costs and vendor risk. Or at the respondent level: fighting fraud while protecting authentic voices, The Harris Poll’s commitment to data quality runs through everything we do.
Want to learn more about our approach to data quality?
Join us at the Sawtooth Software Conference this May, where Edward Paul Johnson and Bob Fawson will share their latest research. In the meantime, reach out to our team to discuss how our quality governance framework can strengthen your research program.