


Brief • 5 min Read
The MacArthur Foundation teamed up with The Harris Poll to review how local wealth and health inequities have continued to affect Chicago residents’ experiences with the COVID-19 pandemic, life expectancies, neighborhood services and resources, local government, and citywide investment initiatives since we first explored the topic in June 2021. What we found is a growing number of disparities, frequently affecting those at lower household income and household wealth levels as well as Residents of Color.
However, what is also clear is that residents believe these problems can be solved with targeted investment in resource access, an optimistic perspective we share.
About This Report
This study was conducted during November of 2021 among Chicago area residents and is largely trended from a similar study we conducted during the second quarter of 2021. Given the fielding period, this study does not include data regarding the influence of the emergence of the COVID-19 Omicron variant, the widespread approval of COVID-19 boosters at the time, the legislative vaccine mandates set to become effective on January 3, 2022, or the impact of the winter holidays.
The key themes covered in this report include
- how Chicago residents perceive and feel about local, race-influenced wealth and health gaps,
- how local inequities combined with demographic differences like race and neighborhood affect the economic outlook of Chicago households,
- how Chicago residents perceive the area’s overall pandemic recovery efforts,
- changing neighborhood trends,
- local resource allocation,
- and disparities in medical treatment and life expectancies.
Identifying Household & Neighborhood Inequities in Chicago
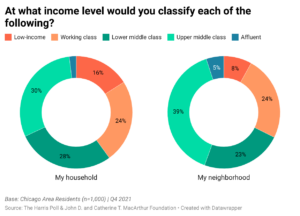
Starting at a high level, most residents consider their neighborhoods to be middle class and feel the same about their households, too. However, the average range for the definition of the middle class has shifted upwards.
Similar to when we last surveyed in June, most Chicago residents consider themselves part of the middle class (58%) with another 40% viewing themselves as lower income. Very few see themselves as affluent or wealthy. Similar trends hold for how they view their neighborhoods, with 62% viewing their neighborhood as middle class.
What has changed over the last six months is that the average resident-provided threshold and maximum for what qualifies as middle class have both gone up among residents. When asked what they believe is the minimum and maximum annual household income necessary to be part of the middle class, on average residents provided a range from $57,000 (an increase of $3,000 from Q2 2021) to $139,000 (an increase of $13,000 from Q2).
Perhaps unsurprisingly, these ranges still vary by income level, race, and location. Asian and Pacific Islander (AAPI) and White residents give higher income thresholds for middle-class status than Black and Hispanic residents do.
Similar to Q2, the wealthier the household, the higher and wider the range given for being considered middle class.
The State of Chicago Households
Similar to six months ago, residents overall are still divided on their current financial well-being, largely along income and wealth lines.
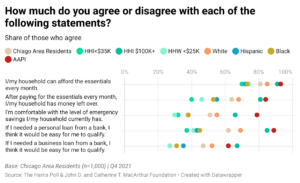
When assessing current household funds and financial health, most residents (81%) still agree they can afford the essentials every month. Although two-thirds of all residents (64%) say that their households have money left over after paying for the essentials, residents are more divided on whether they are comfortable with their level of emergency savings (51% comfortable vs. 49% uncomfortable).
Such financial concerns are exacerbated among those with annual household incomes under $35,000. Only 40% of these residents say their households have leftover funds after paying for essentials, and only 32% are comfortable with their level of emergency savings. Similar trends also exist for those who have an overall household wealth under $25,000.
Compared to AAPI and White residents, Black and Hispanic residents also display a lower level of comfort with their financial well-being.
Such uneasiness about current emergency funds is further exacerbated by the gaps in those who feel confident they could secure extra funds via loans. Unsurprisingly, those with higher household incomes feel more comfortable obtaining personal and business loans than those at lower income and wealth levels. Similar differences hold by race with AAPI and White residents expressing more confidence in obtaining a loan than Black and Hispanic residents.
Even so, Chicago residents, especially those in lower- or middle-income households, report an increase in saving behaviors over the last six months.
For example, 37% of those with household incomes under $35,000 and 42% of those with incomes under $50,000 say they are actively contributing to some type of long-term savings like a 401(k) plan, a savings account, or a stock portfolio. This is an increase of 11 percentage points from June 2021.*
Moreover, two-fifths of those with a household income under $50,000 say they are currently saving for a major purchase, an increase of 14%.
These trends are also consistent when examining residents by ethnicity: both White residents and Residents of Color report increases in long-term savings contributions and report more often that their households are saving for a major purchase.**
These saving trends reveal that although some residents are feeling the pressure of higher, local living costs, most residents do expect their financial situation to improve over time, both for them and for their children.
Currently, 69% of all area residents believe that their annual household income will increase over the next five years, up 12% from Q2 2021. Similar increases are reported across regions, household income (and self-described class) levels, and race. These patterns also hold when we look at household income expectations over the next 10 years.
That said, there are some differences when looking at residents by characteristics such as income. For example, those with household incomes under $35,000 under-index compared to the area average on the likelihood that their income will increase over the next five years, especially when they are compared to those with a household income of $100,000 or more.
Looking to the future, more than three-quarters of those with children under 18 in their household say it is likely that their children will have a better standard of living than they do – an increase of 9%.
A Deep Dive into Neighborhood Inequities
Overall, Chicago residents feel confident about their neighborhood’s local economy, two-thirds of all still residents say that their neighborhood’s economy is healthier than that in other neighborhoods. However, those with lower household incomes, those living in the city itself, and Residents of Color agree on this point less often. Such sentiment has stayed the same over the last 6 months, pointing to a consistent concern about neighborhood prosperity among these groups.
Chicagoans’ attitudes toward their neighborhoods and the economic situation in Chicago are largely unchanged, reinforcing the idea that residents’ increasing optimism is heavily influenced by their financial situation relative to their environment, not just the situation of their local environment.
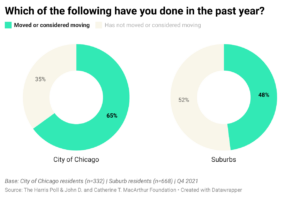
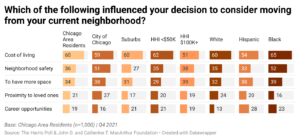
Nearly two-thirds of all residents living in the City of Chicago have moved or considered moving from their current neighborhood or from the Chicagoland area altogether in the past year, an uptick of 9%. Just under half of all suburban residents have done the same, slightly down from Q2 by 4%.
More than half of Chicagoans who moved or considered moving in the past year did so, at least in part, because of the area’s cost of living (60%). This is especially true for Black residents (65%) and those with household incomes under $50,000 (62%).
Compared to all area residents (36%), neighborhood safety — the second-most common reason for considering a move — was especially important for more than half of city residents (51%) and Black residents (52%).
For many residents, concerns about the cost of living may be affected by the state of affordable housing. Our study found that based on household cost reporting by residents, the area is becoming especially costly for certain segments of Chicago’s population.
Nearly half of all residents (46%) still say the affordable housing situation is worse in Chicago than in other cities (unchanged from Q2). There has also been an uptick in those who no longer live in affordable housing based on federal thresholds and self-reported housing costs.
The federal government establishes the threshold for unaffordable housing as any housing whose cost is greater than 30% of a household’s annual income. For this study, we again asked residents to provide the percentage of their annual income that goes toward mortgage or rent payments. Residents were not made aware that this question was being used to estimate affordable housing situations or that the threshold for unaffordable housing is 30% of annual household income.
Overall, 3 in 5 area residents still live in affordable housing based on the self-reported, estimated percentage of what they pay in housing costs. However, for those living in the city, there has been an 8% uptick in those who do not live in affordable housing. Residents of Color and those with lower household incomes also show larger estimates of unaffordable housing than their counterparts.
Unsurprisingly, those with higher household wealth also exhibit higher instances of living in affordable housing. Of those with less than $25,000 in household wealth, just 46% are estimated to live in affordable housing, compared to 89% of those with a household wealth of $500,000 or more.
Signs of Optimism
Still, residents are hopeful. Although cost of living remains the primary reason residents consider moving, most residents still agree that they will be able to afford to live in their neighborhood 20 years from now.
Additionally, the majority of residents still believe their neighborhoods are on the upswing and have improved over the last five years. This holds across race, income, and area of residency (city vs. suburb). However, gentrification and declining racial diversity are a primary concern for roughly two-in-five of those with lower household incomes, Residents of Color, and city residents.
There is also optimism about the economic mobility of those growing up in Chicago neighborhoods – though key differences by income and race continue to exist.
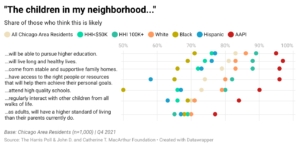
As we did in Q2, in this study we asked residents about their thoughts on the likelihood of certain economic mobility indicators among the children in their neighborhoods to understand how residents perceive local economic mobility. Although there have been very minor dips in overall sentiment across indicators, most residents still believe their neighborhood’s children face a very bright future – though there are some key differences by income and race.
The spread in likelihood has widened, especially between AAPI residents and Black residents when compared to Q2. This is especially true regarding higher education and quality schools, life expectancy, resource access, and interactions with a diverse range of other children.
Gaps have also increased when looking at different income levels. This is primarily because fewer lower income residents than high income residents feel as optimistic about the children in their neighborhoods, especially regarding higher education, life expectancy, and resource access.
Neighborhood Resource Inequities
Most residents disagree that all Chicagoans have access to the resources they need to secure their future. Such concern is supported by a review of available resources in one’s neighborhood.
Less than half of those living in the City of Chicago (44% vs. 52% of suburban residents) agree that Chicagoans from all walks of life have access to the resources that they need to secure their future.
Perhaps unsurprisingly, those who belong to historically marginalized communities (e.g., lower-income households, Residents of Color) are more skeptical about the equity of resource allocation. Only 45% of those who self-identify their household as low-income (i.e., low income or working class) and 46% of Residents of Color agree that all Chicagoans have adequate access to necessary resources, compared to 50% of all Chicago area residents.
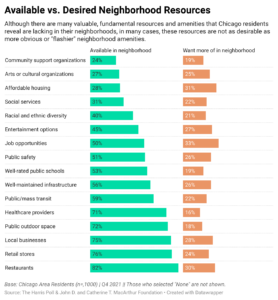
When we look at the 10 least reported resources and the 10 most desired resources among all area residents, we learn that although residents often note they lack fundamental resources like community support organizations, social services, and racial diversity, residents are more interested in seeing obvious, flashier neighborhood amenities like an increase in jobs, businesses, and entertainment options.
When we explore resource distribution in Chicago, unsurprisingly, we find that the presence of services and amenities in neighborhoods is largely a function of income.
For example, unlike those in households making less than $50,000 annually, most of those living in households making more than $50,000 annually say their neighborhoods have well-rated public schools, public safety, job opportunities, entertainment options, and well-maintained infrastructure. These higher income level households also say more often that they have local businesses, public outdoor space, community support organizations, social services, healthcare providers, stores, and restaurants.
Their most desired resources, however, are similar to other area residents with an emphasis on jobs, entertainment and retail options, and better infrastructure.
Neighborhood Investment Strategies
Given the consistency across residents in desired versus more necessary neighborhood amenities, Chicago leadership has a mix of both long- and short-term investment strategies it can implement depending on its priorities with residents.
City leadership can pursue resident desires centered on urban development for quicker investment wins. They can especially target these services for neighborhoods with lower incomes and Residents of Color to boost resident satisfaction.
When analyzing the performance of “flashier” neighborhood amenities, such as job opportunities, restaurants, local businesses, and entertainment, residents in the City of Chicago, People of Color, and those with household incomes under $35,000 report lower levels of approval than their counterparts.*** Investments in these sectors would bolster satisfaction and support among some of the city’s most disadvantaged residents.
Though it may be less ostentatious, city leadership should continue to develop the residential support that residents note is missing. They can prioritize these services for city residents to boost resident satisfaction. Among these city residents, community support organizations, affordable housing, and social services had lower quality ratings.
At the same time, city leadership will still need to promote investment in the universal, neighborhood fundamentals that are especially important in resolving local inequities for historically marginalized groups and neighborhoods. This includes services like public schools, healthcare providers, racial and ethnic diversity, and infrastructure – things those with lower incomes were most concerned about. Investing in these will be important to improving the overall quality of life for all residents.
Assessing Health & Wealth Inequities in Chicago
Understanding Perspectives on Local Life Expectancies
Most Chicagoans (68%) acknowledge the very real disparities in life expectancy between White residents and Residents of Color.
Today, in the City of Chicago, non-Black residents are expected to outlive Black residents by more than nine years while non-Hispanic residents are expected to outlive Hispanic residents by roughly one year.
Most Chicagoans acknowledge these disparities. Two-thirds (68%) of all Chicago area residents – with little to no difference across racial groups – agree that the life expectancy of Black residents is shorter than that of non-Black residents. Similarly, a little over half (54%) agree that the life expectancy of Hispanic residents is shorter than that of non-Hispanic residents.
Most importantly, though about 80% of all residents agree that the issues that negatively impact the quality and longevity of life among Residents of Color are preventable.
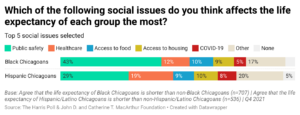
Digging deeper, we learn that safety and access to resources are identified as the issues that, in the eyes of residents, most affect life expectancy for Chicago’s Residents of Color.
Among those who agree that Black residents have a shorter life expectancy than non-Black residents, public safety (43%), access to healthcare (12%), and access to food (10%) are viewed as the most influential social issues on Black life expectancy.
Among those who agree that Hispanic residents have a shorter life expectancy than non-Hispanic residents, public safety (29%), access to healthcare (19%), and COVID-19 (8%) are viewed as the most influential social issues on Hispanic life expectancy.
It’s worth noting that the issues noted by White residents are often different from those reported by Residents of Color. White residents who agree that there is a gap in Black and non-Black life expectancy view healthcare as the most influential factor. However, Black residents who agree about the same life expectancy gap cite other social issues as more influential, such as access to housing (i.e., low homeownership rates or lack of affordable housing) (10% vs. 5% of White residents) and lack of neighborhood development (9% vs. 3% of White residents).
Similarly, White residents who agree there is a life expectancy gap for Hispanic and non-Hispanic residents more often attribute the difference to public safety (38%) than Hispanic residents do (31%).
Chicagoans also recognize the influence that government support and the COVID-19 pandemic may have on life expectancy.
For example, 44% of those who agree that Black residents have a lower life expectancy than non-Black residents say that insufficient support from local government plays a role. Just 5% consider it the most influential factor.
Additionally, over a third (36%) of those who agree that Hispanic residents have a lower life expectancy than non-Hispanic residents say that Hispanics have a lower life expectancy than non-Hispanic residents also say insufficient support from local government plays a role. Only 7% consider it the most influential factor.
The COVID-19 pandemic is viewed as even more influential. COVID-19 is seen as an influential factor of life expectancy by 46% of those who agree that Black residents have a lower life expectancy than non-Black residents and 43% of those who agree that Hispanic residents have a lower life expectancy than non-Hispanic residents. Five percent consider COVID-19 the most influential factor in lower life expectancy for Black residents while 8% consider it to be the most influential factor in lower life expectancy for Hispanic residents.
For city leadership, there is a clear takeaway: addressing racial disparities in COVID-19 support should be a priority, both to keep residents safe and to earn their trust.
Chicago’s COVID-19 Recovery: A Varied Pandemic Experience
The COVID-19 pandemic’s impact on quality of life is significant, and from an economic perspective, its impact is worsening. The pandemic has had a disproportionate impact on Chicago’s Communities of Color, growing worse over time.
Six in 10 Chicagoans – with little difference across racial groups – agree that Residents of Color have been more negatively affected than White residents by the COVID-19 pandemic. Throughout the pandemic, Chicago’s Residents of Color have reported more frequently than White residents that they have had concerns about their household’s financial security. Although this concern has decreased over the last six months –- from 74% to 65% — their concern remains higher compared to White residents (61%).
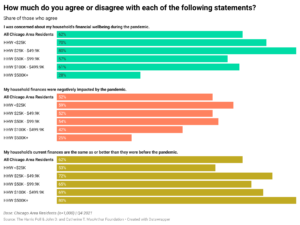
More significant is the jump in the number of Residents of Color who report that their personal financial situation has worsened during the pandemic. Currently, 62% of Chicagoans of Color report that their household finances were negatively impacted by the COVID-19 pandemic, an increase of 10% from June 2021. During the same period, however, the share of White Chicagoans who say their financial situation suffered due to the pandemic has decreased from 50% to 45%.
In terms of recovery, fewer People of Color report that their household’s financial situation has recovered, both over time and when compared to White residents. Only 57% of all Residents of Color agree that their household’s current finances are the same as or better than they were before the pandemic started, down from 65% in Q2. Conversely, 65% of White residents now report that their household’s current finances have rebounded.
Naturally, wealth and security go hand-in-hand. Those with a household wealth under $25,000 agree they have been worried about their household’s financial well-being during the pandemic at nearly three times the rate of those with a household wealth of $500,000 or more (70% vs. 28%, respectively). They also report that their household finances were negatively impacted by the pandemic at more than twice the rate of those with a household wealth of $500,000 or more (59% vs. 25%).
On the flip side, more than two-thirds of those with a household wealth of $100,000 or more –- and 80% of those with a household wealth of $500,000 or more — say their household’s current finances are the same as or better than they were before the pandemic started (i.e., before March 2020) compared to 53% of those with a household wealth under $25,000.
The pandemic’s reach extends beyond individual households. The share of Chicagoans of Color who feel that their neighborhood has successfully handled the COVID-19 pandemic has decreased from 78% to 72% over the last six months.
On the other hand, White residents’ impression of their neighborhood’s pandemic response efforts has improved. Nearly 9 in 10 White Chicagoans (88%) now agree that their neighborhood has successfully addressed the COVID-19 pandemic, an increase of 4%.
More broadly, impressions of Chicago’s COVID-19 recovery efforts have fallen since last summer. In the eyes of residents, Chicago’s performance relative to other U.S. cities has declined: just 25% of residents say that the recovery in Chicago is comparatively better, down from 35% six months ago.
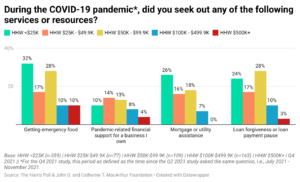
As the year comes to a close, residents report little change in the types of resources they have sought during the pandemic, reinforcing the need for a redesigned recovery plan.
Between July and November of 2021,
- 77% of Chicagoans received or attempted to receive a COVID-19 vaccine (up 2% from those who said they did the same between March 2020 and June 2021),
- 68% purchased personal protective equipment (PPE) or household supplies (up 2%),
- 23% sought emergency food (up 2%), and
- 15% required mortgage assistance or loan forgiveness (down 1%).
Two years into the COVID-19 pandemic, it is not entirely surprising to see some behaviors hold steady. Testing and vaccination are still effective ways to slow the spread of the virus or lessen the severity of infection, homes still need to be cleaned, and at the time of this report’s publishing, there is still a mask mandate in place that influences the demand for PPE and household supplies.
That said, the fact that so many Chicagoans continue to need assistance meeting their basic needs indicates that there may be forces outside of the pandemic that need to be considered.
There is a visible relationship between household wealth and the demand for requested resources during the pandemic – a relationship that further proves the disparate influence of household wealth.
Wealth inequity has also cushioned the impact of the pandemic for many households, allowing most of those who have accumulated more financial resources to forego pandemic-related assistance.
Residents with a household wealth (financial assets excluding retirement savings and secondary homes) under $25,000 sought assistance for living essentials during the pandemic more often than wealthier households. For example, 32% of these residents sought emergency food between July and November 2021 compared to 10% of those with a household wealth of $100,000 or more.
The same trend exists among Residents of Color, likely driven, at least in part, by the known relationship between race and ethnicity and household wealth. For example, 31% of Residents of Color sought emergency food compared to just 18% of White residents between July and November 2021. Separately, 23% of Residents of Color needed mortgage or utility assistance compared to only 11% of White residents.
However, in terms of medical resources, Residents of Color diverged from the trends seen among other Chicago segments. Compared to what they reported six months ago, most under-indexed for seeking a COVID-19 vaccine and over-indexed for seeking a COVID-19 test.
Compared to 81% of White residents, 70% of Residents of Color attempted to get vaccinated against COVID-19. Compared 53% of White residents, 64% of Residents of Color also attempted to get tested for COVID-19.
U.S. Bureau of Labor Statistics data show that, in general, American Residents of Color more often report working in service positions. Additionally, they report less often that they own private vehicles, both of which could lead to increased COVID-19 exposure and increased need for testing. That said, there are also signs that point to a more systemic issue related to resource allocation in Chicago.
Limited access to pandemic-related support resources has likely contributed to the growing disparities between White Chicagoans and Residents of Color.
Poor access to pandemic-related services and a lack of information about the risks and benefits of vaccination may be leading to lower vaccination rates.
Residents of Color agree more often that their neighborhood has had access to fewer pandemic-related support resources than other neighborhoods in the Chicagoland area (38% of Residents of Color vs. 32% of all residents).
More than half of all Chicagoans (56%) – and 64% of Chicagoans of Color – also agree that programs encouraging Chicagoland residents to get vaccinated against COVID-19 (e.g., community outreach, public service announcements) should focus more on People of Color than on White residents.
Moreover, the pandemic’s impact on Asians is especially unique – and could be lasting. Two-thirds of AAPI residents don’t think their neighborhood will recover as quickly as other neighborhoods in Chicago, a departure from reports of an otherwise positive pandemic situation. Additionally, one in six AAPI residents feels that their neighborhood had access to fewer pandemic-related resources. Separately, about a quarter do not agree that their current household finances are the same as or better than they were before the pandemic.
Throughout the pandemic, discussions about related racial and economic disparities have focused on deep-rooted systemic biases. However, this anticipation of a slowed neighborhood recovery indicates that AAPI residents may still be feeling the effects of the discrimination that they have faced as a result of the COVID-19 outbreak’s origin. For local leadership, this is an important note: equitable recovery is not possible without addressing these new social biases.
Moving to a Better Normal
Chicago’s health and wealth inequities are the direct result of a history of systemic racial and economic segregation. Despite the challenges that come with these structural issues, residents are convinced that repairing the city’s health and wealth inequities starts with expanding access to fundamental resources.
Residents appear eager to see city leadership promote initiatives that will jumpstart progress in historically disadvantaged communities. To improve overall quality of life, these investments will need to account for both long-time disparities as well as those brought on by the pandemic. Such steps will not only help remedy systemic issues but will also encourage public support and involvement in addressing Chicago’s health and wealth inequities long after the pandemic has ended.
Research Notes
*Unless otherwise indicated, all percentage changes should be interpreted as percentage point increases or decreases from June/Q2 2021.
**Given the period of fielding, it’s possible that the saving for major purchases may be indicative, in part, of money being saved for holiday spending.
***Approval ratings are based on those who say the overall quality of each amenity or service currently available in their neighborhood is good, very good, or excellent.
Methodology
This survey was conducted online within the United States between November 1, 2021, and November 19, 2021, among 1,000 adults (aged 18 and over) in the Chicago DMA by The Harris Poll on behalf of the John D. and Catherine T. MacArthur Foundation. Figures for age, sex, race/ethnicity, education, region, and household income were weighted where necessary to bring them into line with their actual proportions in the population. Propensity score weighting was used to adjust for respondents’ propensity to be online. This study is trended from a similar survey run in Q2 2021 (June 21, 2021, to July 8, 2021) among 1,004 adults (aged 18 and over) in the Chicago area.
Given the period of fielding, this study does not include data regarding the influence of the emergence of the COVID-19 omicron variant, the recent widespread approval of COVID-19 boosters, the legislative vaccine mandates set to become effective on January 3, 2022, and the winter holidays.
Chicago residency was verified by having users indicate their state using a multiselect screener question, their zip code using an open-ended screener question (zip codes were tagged to respective neighborhoods), and their neighborhood using an open-ended screener question. Those who indicated they lived in a state outside Illinois or those whose self-selected county did not correctly correspond to the zip code provided were removed before the main survey started. Those who entered a neighborhood in the open-ended screener question that was not the same as or geographically close to the neighborhood(s) indicated by their zip code were also removed from the set of qualified respondents.
Figures for age, sex, race/ethnicity, education, region and household income were weighted where necessary to reflect the composition of Chicago’s adult population. Three additional weights were created in order to accurately report on residents of the City of Chicago, Cook County suburb residents, and all suburban residents outside Cook county. Propensity score weighting was used to adjust for respondents’ propensity to be online. All sample surveys and polls, whether they use probability sampling, are subject to multiple sources of error which are most often not possible to quantify or estimate, including sampling error, coverage error, error associated with nonresponse, error associated with question wording and response options, and post-survey weighting and adjustments. Therefore, the words “margin of error” are avoided as they are misleading. All that can be calculated are different possible sampling errors with different probabilities for pure, unweighted, random samples with 100% response rates. These are only theoretical because no published polls come close to this ideal. Because the sample is based on those who agreed to participate in the online panel, no estimates of theoretical sampling error can be calculated.
Responses were tested for statistical significance using a Z-test with a confidence level of 95% and a Z-test with a confidence level of 90%. For more information on methodology, please contact Dami Rosanwo or Madelyn Franz.
For more information on The Harris Poll’s partnership with the MacArthur Foundation, please contact Kristen Mack.
Subscribe for more Insights
Subscribe to our newsletter for the latest trends in business, politics, culture, and more.
Download the Data
Get the full data tabs for this survey conducted online within the United States by The Harris Poll on behalf of the John D. and Catherine T. MacArthur Foundation between November 1-19, 2021, among 1,000 U.S. adults ages 18 and older.
Download
Subscribe for more Insights
Subscribe to our newsletter for the latest trends in business, politics, culture, and more.
Download the Data
Get the full data tabs for this survey conducted online within the United States by The Harris Poll on behalf of the John D. and Catherine T. MacArthur Foundation between November 1-19, 2021, among 1,000 U.S. adults ages 18 and older.
DownloadRelated Content